

Eliminating the Medicare Advantage Star Ratings System

Issue Summary
The Medicare program operates the Star Ratings system, which is intended to improve the quality of care delivered to enrollees of Medicare Advantage (MA) plans. Plans are scored on about 45 performance measures (the exact number changes over time). The measures are used to calculate Star Ratings ranging from 1 to 5. Plans that score 4 Stars or above receive a benchmark up to 5 percentage points higher (10 percentage points higher in double-bonus counties) through the Quality Bonus Program (QBP). Plans with higher Star Ratings are also given a higher rebate percentage (the share of the gap between the benchmark and bid that the plans are allowed to use to fund additional benefits). The QBP increases Medicare spending by approximately 1.2%, but evidence suggests the QBP, and the Star Ratings system more broadly, has not meaningfully increased quality.
Policy Recommendation
Eliminate the Medicare Advantage Star Ratings system. Specifically, this entails:
- Eliminating the QBP;
- Eliminating the Stars-related rebate percentages (setting the common rebate percentage to approximate the current average);
- Replacing the use of Stars in Medicare Plan Compare with narrower measures such as enrollee satisfaction and, where possible, plan network breadth/stability and utilization-management stringency;
- Eliminating other roles for Stars, such as Stars-related enrollment rights;
- Developing other focused programs to address gaps in quality, with interventions tailored to specific objectives and particular attention paid to low performers.
Potential Savings
Elimination of the QBP will directly save $13 billion to $16 billion annually. Additional indirect savings may stem from lower administrative costs for plans, providers, and CMS, though those have not been estimated. These savings would be offset by any replacement program intended to guard against plans delivering substandard care (though other safeguards, such as network adequacy rules, exist).
Background
The Centers for Medicare and Medicaid Services (CMS) operates the Star Ratings system to promote the quality of care delivered to beneficiaries of Medicare Advantage (MA) plans (and implicitly guard against incentives plans may have to stint on care). The Star measures are tied to clinical quality, administrative capability, and patient experience. Medicare collects close to 100 quality measures from MA plans, of which roughly 45 feed into the Star Ratings for plans offering drug coverage. The measures draw on Healthcare Effectiveness Data and Information Set (HEDIS) clinical records, the Consumer Assessment of Healthcare Providers and Systems (CAHPS) enrollee survey, the Medicare Health Outcomes Survey, prescription drug event data, and administrative data collected by CMS or its contractors. CMS scores each measure from 1 to 5 Stars against cut points it recalculates annually from the distribution of all reporting contracts. It then combines them, giving process measures a weight of 1, patient-experience, complaints, and access measures a weight of 2, outcome and intermediate-outcome measures a weight of 3, and the two improvement measures, which capture year-over-year change in a subset of the other measures rather than point-in-time performance, a weight of 5 apiece. In addition to rewarding absolute performance and improved performance, the formula rewards plans for low variation in performance across the measures. CMS applies a reward factor that can add as much as 0.4 Stars for contracts that combine low variance with high average performance (CMS 2026b). To account for differences in enrollees’ socioeconomic status (SES) that may affect performance, CMS adjusts a plan’s overall rating based on the plan’s share of enrollees who are dually eligible, receiving a low-income subsidy, and disabled.
The Star Ratings system strives to accomplish its goals in three ways. First, it incents plans to perform better by financially rewarding high-performing plans through the Quality Bonus Program (QBP). Specifically, MA plans are paid based on their bid (each plan's estimate of what it will cost to cover a typical enrollee's Medicare Part A and B benefits) relative to a benchmark. Each county’s benchmark is set as a share of its projected per capita fee-for-service spending, ranging from 95% in the highest-spending quartile of counties to 115% in the lowest. Contracts with 4 or more Stars generally have their benchmarks raised by 5 percentage points, and by 10 percentage points in designated double-bonus counties. The exact bonus depends on whether the county is subject to Affordable Care Act (ACA)-related benchmark caps (which limited quality bonus increases in 45% of counties, but just 19% of MA enrollment, in 2016; MedPAC 2021) or whether they are new plans (which would qualify for a 3.5 percentage point bump, subject to the benchmark cap).
Second, higher-performing plans are given a higher rebate percentage, which is the portion of the gap between the plan’s benchmark and bid that plans can retain to finance lower premiums or more generous benefits. Specifically, plans with less than 3.5 Stars have a rebate percentage of 50%. Plans with 3.5 or 4 Stars have a rebate percentage of 65%. Plans with 4.5 or 5 Stars have a 70% rebate percentage. Rebate dollars finance lower premiums, lower cost sharing, or supplemental benefits, though plans also apply some of the added funds to administrative costs and profit. Because of the connection between rebate percentage and benefit generosity, a higher rebate percentage gives plans a competitive advantage.
Third, CMS uses Stars to inform beneficiaries about plan performance through the Medicare Plan Compare tool, which may steer enrollees to better scoring plans and thus indirectly incent plans to perform better. Relatedly, the rating also carries an enrollment right: beneficiaries may move into a 5-Star plan once per year outside open enrollment.
The primary critique of the Star Ratings system, particularly the QBP, is that the added spending (about 1.2% of Medicare spending; MedPAC 2026) is not yielding any better quality (Meyers, Trivedi, and Ryan 2025). Moreover, there are concerns that the system is subject to gaming and documentation efforts, often unfair, and costly to administer for plans, providers, and CMS. In fact, CMS has been subject to several lawsuits regarding the methods of calculating Star Ratings measures, the data gathering approach, and the rulemaking process (e.g., SCAN Health Plan v. HHS 2024; Clover Insurance Co. v. HHS 2026), all of which add to the administrative burden of the system.
Evidence Base
The evidence supporting this proposal spans several points. First, and most importantly, the association between the Star Ratings system and quality is likely small. For example, Stars are not associated with mortality. Second, plan performance on Stars is not very responsive to payment incentives. Removal of Stars may have a different impact than raising incentives for better performance on Stars, but the evidence casts doubt on strong responsiveness of plans to the scale of payment. Third, policies tied to Star Ratings may penalize plans serving lower SES populations. Fourth, the Star Ratings system adds spending and administrative expenses for plans, providers, and CMS.
The association between the Star Ratings system and quality is likely small
A foundational assumption of all policies tied to Star Ratings is that the Stars are associated with quality. The measures themselves are validated, but in practice they may be affected by documentation efforts including gaming, and unobserved case mix or SES that confound the relationship between measured Stars and true quality.
Assessing the relationship between Stars and quality is difficult because quality is multi-dimensional with no gold standard of measurement. The best related evidence is from Abaluck et al. (2021) who relate the observed Stars to an econometrically estimated measure of plan-level mortality. The key innovation is to use plan terminations as an instrument to separate causal plan effects on mortality from unobserved case mix and SES effects. They document large differences in one-year mortality across plans operating in the same county; however, CMS Star Ratings are uncorrelated with those effects.
This does not rule out an association between Stars and other dimensions of quality. However, other literature, with broader outcomes, does not find a meaningful impact of the QBP on quality (Markovitz et al. 2021b). Moreover, any relationship between policies tied to Star Ratings and some dimensions of quality may reflect the higher payment associated with Stars that leads to more generous coverage, rather than the incentives for plans to improve quality that are embedded in the narrative around Stars.
Plan performance on Stars is not very responsive to payment incentives
In most counties, the QBP rewards plans that have 4 or more Stars with a 5 percentage point benchmark increase. Some counties (specifically, urban floor counties with low spending and high 2009 MA penetration) are designated double-bonus counties, where the 4+ Star plans get up to a 10 percentage point increase in their benchmark. Using the variation between single and double-bonus counties, Layton and Ryan (2015) use county-level difference-in-differences over 2009 to 2014 with a matched comparison group and find that double-bonuses produced a statistically insignificant change in average Star Ratings of 0.034 Stars, roughly 1% (with a 95% confidence interval running up to only 0.083), and no effect on any individual measurement domain.
Policies tied to Star Ratings may penalize plans serving lower SES populations
CMS partially adjusts for SES through the Categorical Adjustment Index, which modifies a plan's overall rating based on its share of dual-eligible, low-income subsidy, and disabled enrollees. This adjustment is coarse: it applies a single correction factor based on a contract's aggregate enrollment mix rather than adjusting individual measures for patient-level risk. MedPAC and others have concluded that current Star Ratings methodology does not adequately account for differences in enrollee social risk (Durfey et al. 2018; MedPAC 2026; Sorbero et al. 2018). To the extent that unmeasured SES drives lower Star Ratings, plans serving more disadvantaged populations may be penalized for factors outside their control, independent of the direct evidence on measurement validity discussed above (Kind et al. 2014). This may have the unintended consequence of reducing benefit availability for beneficiaries in plans that disproportionately enroll more disadvantaged populations or reduce plans’ capacity to better serve those beneficiaries (McWilliams et al. 2023).
The Star Ratings system adds spending and administrative expenses for plans, providers, and CMS
The Star Ratings system entails both direct and indirect costs to Medicare and the health system overall. The direct cost of the system is largely due to the QBP. Three independent estimates put the direct cost of the QBP in a similar range for 2026: MedPAC (2026) estimates about $16 billion (roughly 1.2% of Medicare spending, or about 2.6% of MA payments), KFF estimates $13.4 billion (Fuglesten Biniek, Ochieng, and Freed 2026), and Dixit et al. (2025) estimate $14.1 billion. All three measure the cost associated with the increase in benchmarks from quality bonuses. The differences in the estimates reflect differences in risk adjustment and data. For example, MedPAC's figure is higher chiefly because it is risk-adjusted, whereas KFF assumes an average risk score of 1.0, which KFF notes understates the true amount. None of the three estimates adjusts for changes in the share of the benchmark to bid spread that CMS retains, though that component is likely to be small, in part because plan bids respond to lower benchmarks. For example, the Congressional Budget Office (2018), in an estimate of the savings associated with elimination of the QBP that is now outdated but similar in magnitude, assumed that bids would fall 50 cents for every dollar in benchmark reduction associated with elimination of the QBP.
Elimination of the Star Ratings system would also generate indirect savings by reducing the administrative burden associated with gathering the data. Performing well on Stars requires attention to clinical documentation. The burden of Stars-specific documentation has not been directly quantified, though a substantial body of work has quantified the burden of external quality measurement more broadly. Physician practices spend an estimated $15.4 billion annually and 785 hours per physician per year on external quality reporting across all payers (Casalino et al. 2016). This burden is evident in CMS rulemaking, stakeholder meetings, and industry press specific to Stars (CMS 2026a). Elimination of that expense would allow plans to bid lower (increasing savings to CMS because CMS retains a share of the benchmark to bid gap). Some of the reduced administrative costs could also flow to CMS because of reduced costs associated with administering the MA program.
Summary
The CMS Star Ratings system has a noble goal but is falling well short. The policies tied to it cost over 1% of Medicare spending and yield little demonstrable benefit.
Policy Recommendation
We propose to eliminate the Medicare Advantage Star Ratings system. This would entail eliminating the QBP, the relationship between rebates and performance, the role that Stars play in Medicare Plan Compare, and a few other policies tied to Star Ratings. We propose that rebates be set at a fixed rate approximating the current average, so the change is roughly budget-neutral on the rebate side; the rate can be adjusted if needed. We propose the Medicare Plan Compare data be designed to reflect data that is difficult for plans to game and obtained directly from administrative data. Such data could include disenrollment rates, measures of network breadth and stability, rates of prior authorization and claims denials, and possibly mortality. Importantly, Abaluck et al. (2021) suggest that on average, variation in adjusted mortality is a reasonable proxy for true quality variation. However, this may be noisy for any particular plan and challenging to compute for small plans and new plans.
The recommendation to eliminate the Star Ratings system should not be interpreted as a recommendation to abandon efforts to improve quality of care. Instead, quality improvement programs should be focused on specific gaps in quality (such as management of blood pressure or diabetes). Interventions may not be directed at health plans and should often not involve pay for performance (Chernew and Schneider 2026). For example, interventions could focus on providers and/or patients. Such interventions could involve benefit design changes, technical assistance, or exclusion from the Medicare program. Particular attention should be paid to addressing low performers or populations with particularly large quality gaps, where the opportunity for improvement is likely greatest and the need to prevent substandard care is greatest.
This proposal will require legislative action.
Potential Savings
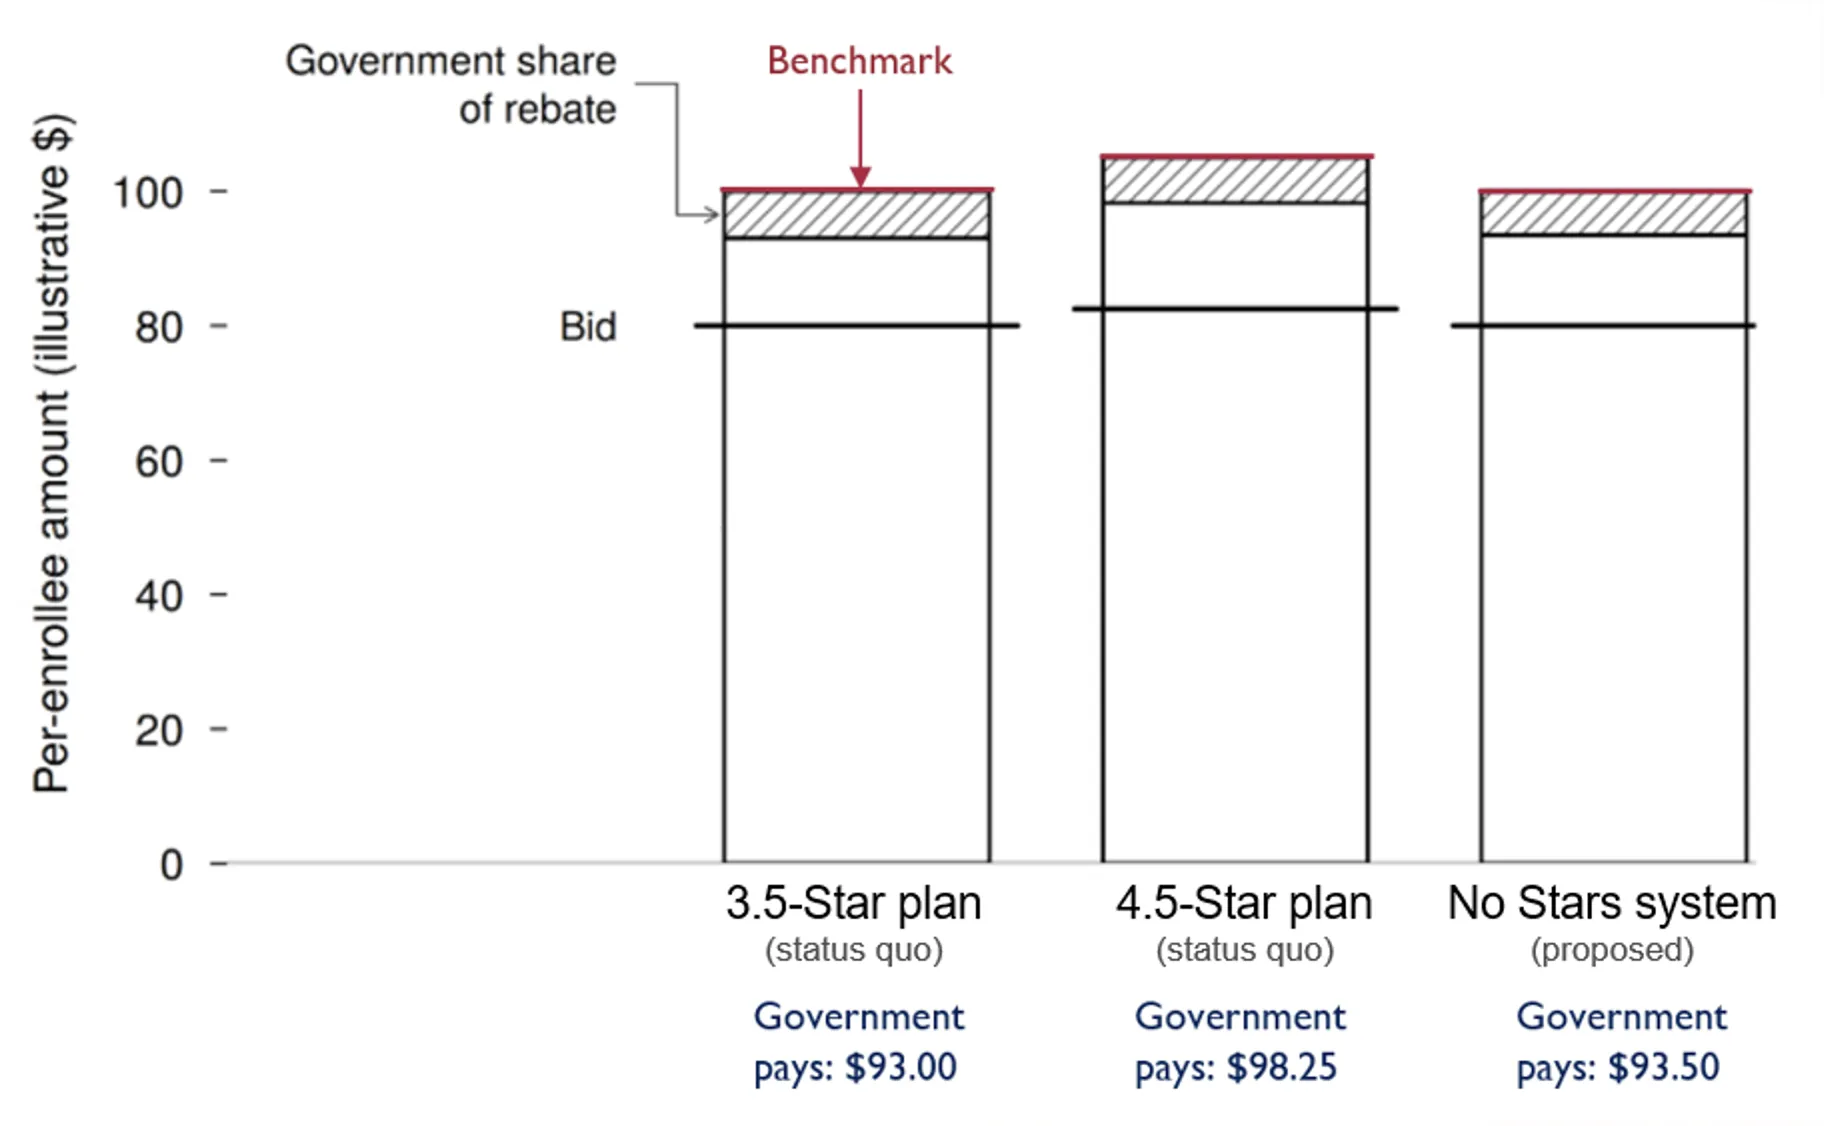
The estimates above suggest savings of about 0.25% of national health care spending (1.2% of Medicare spending). Setting a single rebate percentage in place of the schedule tied to Star Ratings yields no federal savings on its own if the rebate percentage is set to be budget neutral. The choice of rate determines only how payment is redistributed between plans above and below the 4-Star threshold. Figure 1 illustrates savings for a 4.5-Star and a 3.5-Star plan in a county where benchmarks are 100% of fee-for-service spending. For simplicity, the illustration assumes a risk score of 1.
There would also be administrative cost savings for plans, providers, and CMS that have not been estimated. These savings would be offset by any replacement program intended to guard against plans delivering substandard care, though other safeguards, such as network adequacy rules, exist.
Figure 1. What Medicare pays a plan, per enrollee, with and without the Quality Bonus Program
Existing Policy Proposals
Two proposals currently exist to reform the QBP along the lines of this brief's recommendation, though both stop short of outright elimination. MedPAC has proposed replacing the QBP with a Medicare Advantage Value Incentive Program (MA-VIP): a smaller set of population-based outcome and patient-experience measures, evaluated at the local market level rather than the contract level, scored against absolute performance targets rather than a relative "tournament" model, and financed on a budget-neutral basis with rewards for high performers offset by penalties on low performers, consistent with how FFS Medicare's other quality programs operate (MedPAC 2019, 2020). MedPAC's proposal is explicitly designed to be budget neutral, meaning if implemented, rewards to high-performing plans would be offset by lower payment to low-performing plans. The parameters would be designed not to impact Medicare spending. Thus, MedPAC's proposal yields no federal savings. Separately, Paragon Health Institute has proposed eliminating the QBP entirely as part of a broader package of MA payment reforms, but that proposal would retain the Stars and associated administrative cost (Kouzoukas and Hammond 2026).
Both proposals target the QBP's payment mechanism, and to that extent they directly address the evidence in this brief that larger bonuses do not improve quality or enrollment (Layton and Ryan 2015; Markovitz et al. 2021a). Neither proposal, however, addresses the measurement-validity concerns raised earlier in this brief; both retain Star Ratings as the basis for rebates and Medicare Plan Compare, so the informational function would continue to rest on ratings that this brief's evidence calls into question.


More Briefs
12%
Paying for Family Caregiving in Long-Term Care Insurance
